Scapi-py is a single-file HTTP API load testing tool
Dead simple, Self-Contained, single-file API load testing tool built on FastAPI.
A lightweight utility for quickly testing external APIs. It lets you generate a small amount of load, experiment with headers, and measure average response times — nothing more. The tool is designed to run anywhere with minimal setup: just launch it and start testing, no extra configuration required.
Source Code: https://github.com/sesav/scapi-py
Sometimes I need a tool to send a few requests to external APIs, generate a bit of load, experiment with headers, check average response times, and so on. I want to be able to launch this tool from any environment with a single command, without having to figure anything out. Existing tools felt inconvenient to me, so I created a tiny utility that generates load and can be launched with just one command. Thanks to the inline metadata format and the uv, there’s no need to manually set up environments. No more worrying about virtual environments.
One file, one command, and your beautiful FastAPI Swagger UI is ready to go.
Quick Start
Install the uv using the official script or via pip install.
Option 1: Run Directly (No Installation)
# Download and run the tool directly
curl -LOs https://github.com/sesav/scapi-py/releases/latest/download/scapi.py
uv run scapi.py

# Or with wget
wget https://github.com/sesav/scapi-py/releases/latest/download/scapi.py
uv run scapi.py
Option 2: Install as Package
# Install from PyPI
pip install scapi-py

# Run the tool
scapi
Option 3: Install with uv
# Install with uv
uv add scapi-py

# Run the tool
scapi
Done!
How to use it
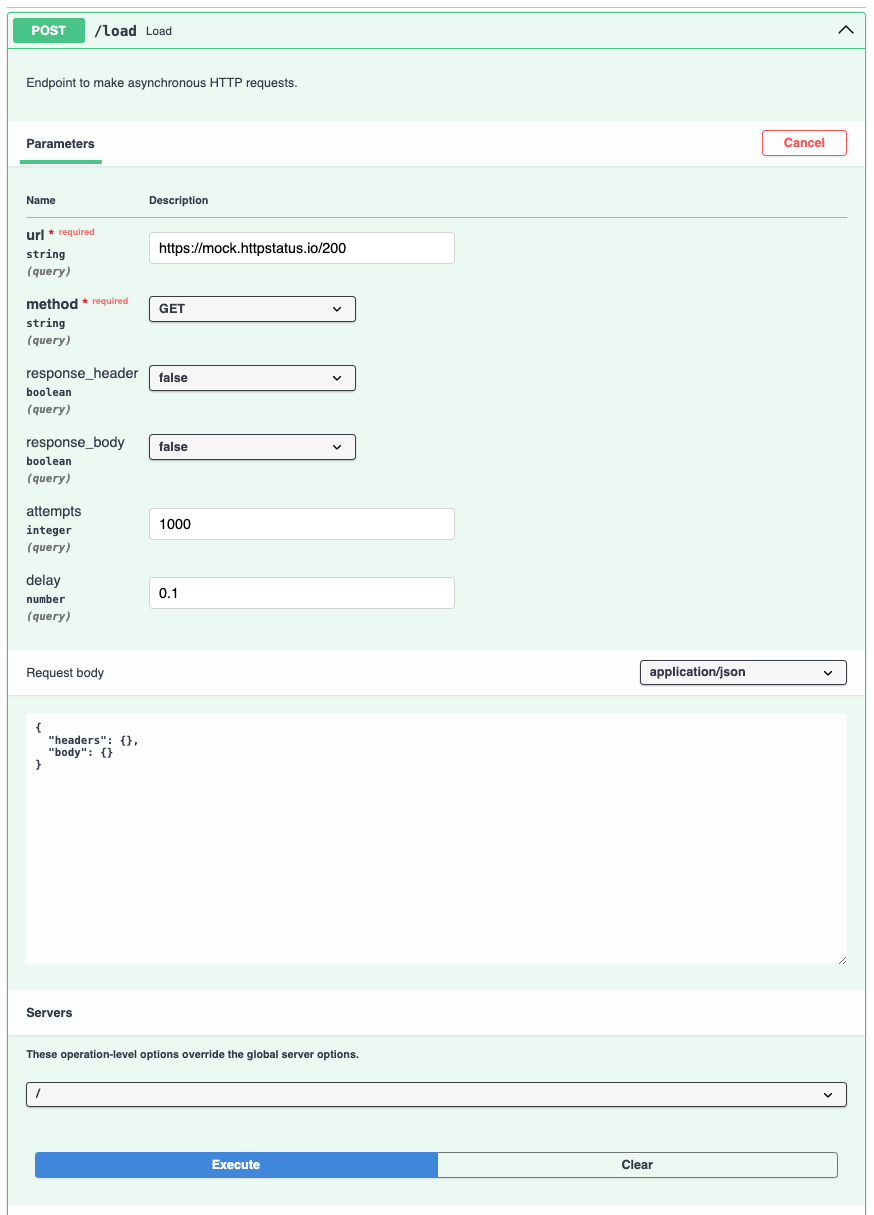
When the application starts, you will see two endpoints: /load and /results.
It’s incredibly simple to use: just specify the domain, request method, delay between requests, number of attempts, headers and body (if needed), and whether you want to display the response body and headers (see the screenshots below). You can also click “Execute” multiple times to generate more tasks for event loop.
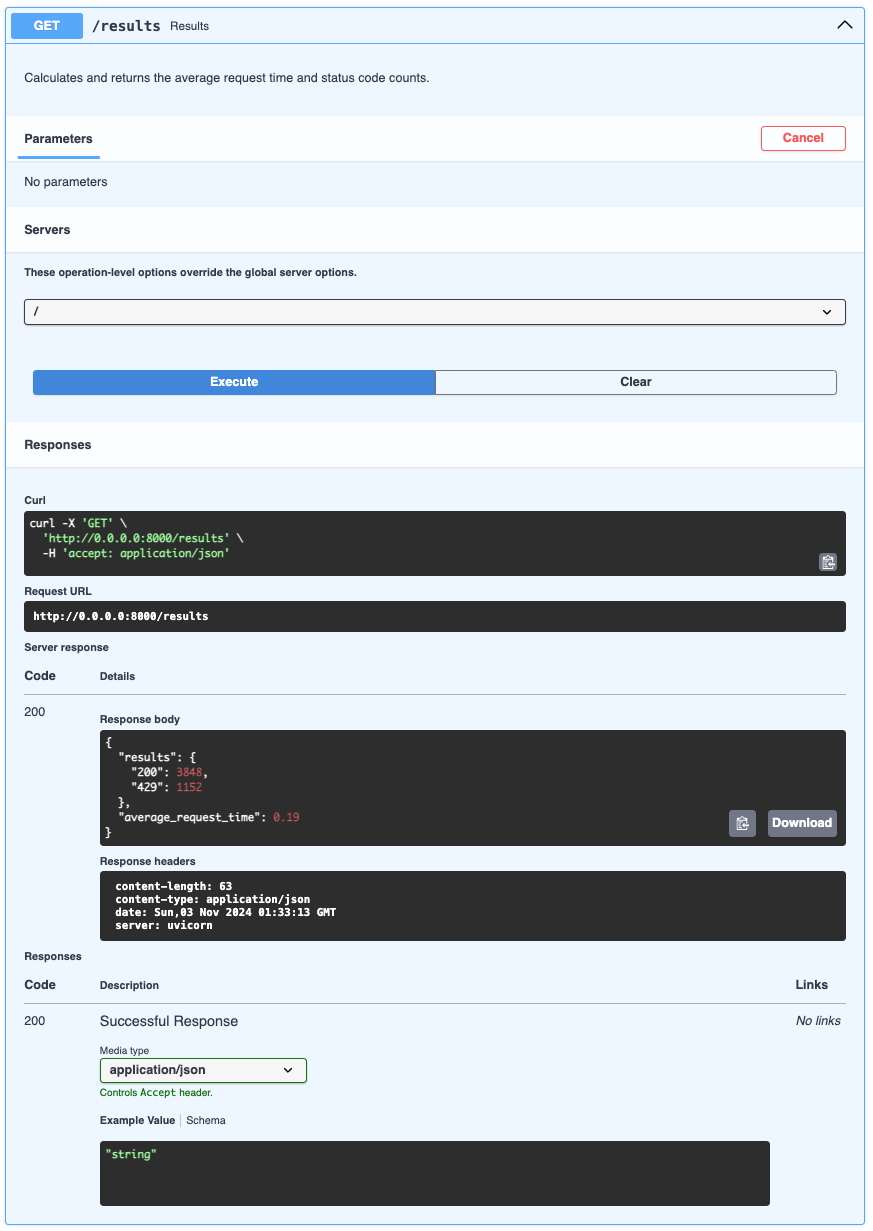
At the end of or during the execution, you can also execute the /results endpoint to see the total number of requests sent, broken down by status, along with the average response time for requests to the specified URL.
And yes, it’s a very basic tool, but sometimes I really need it.